Advertisement
Picture yourself in an open field with scattered trees. Now, draw lines so each patch of land belongs to the nearest tree. Those divisions form a Voronoi diagram. Though the concept sounds abstract, it shows up in many places: cell coverage, city planning, and even nature. The name isn't common outside technical fields, but the logic behind it—assigning areas based on proximity—makes it quietly useful. This article walks through what Voronoi diagrams are, how they're made, and why they matter across different disciplines, from data science to geography.
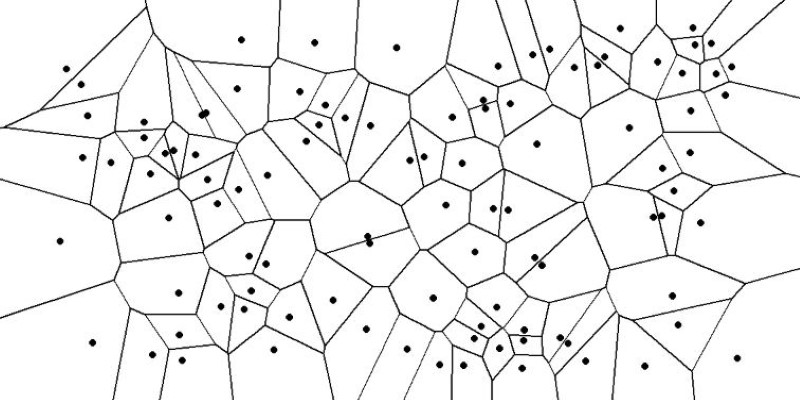
A Voronoi diagram divides space based on the distance to a given set of points. Each point, or "site," claims the region that's closer to it than to any other. These regions, called Voronoi cells, surround their generating points and form polygonal shapes. The lines dividing them are typically straight segments, creating a web of borders that neatly carve up the space.
Though the idea existed in earlier centuries, it was Georgy Voronoi's 1908 work that formalized it. Voronoi diagrams gained importance alongside computational geometry, particularly in the 20th century. In two dimensions, the cells are polygons. In three, they're polyhedra. Go higher, and they form complex multi-dimensional regions.
Their usefulness comes from their grounding in distance. This makes them ideal for dividing areas by influence, whether assigning homes to hospitals or mapping territory for delivery services. In machine learning, Voronoi diagrams help in visualizing classification zones—especially for nearest-neighbor methods, where proximity defines group membership.
To construct a Voronoi diagram, you start with a few seed points on a plane. Every location is assigned to the nearest point. The dividing line between two regions is where both points are equidistant—this forms the edge. Each seed ends up with a cell made of all the locations nearest to it.
As more points are added, existing cells shift. New boundaries form. Each change reshapes the diagram. Though the basics can be drawn by hand for a small set, computing larger diagrams needs efficient algorithms. Fortune’s sweep line algorithm handles two-dimensional diagrams well. For 3D or changing datasets, incremental methods are more practical.
A notable feature of these diagrams is their structure. Where three or more cells meet, you get Voronoi vertices. These points are equally distant from multiple sites and often mark areas of shared influence, which is important in planning and optimization.
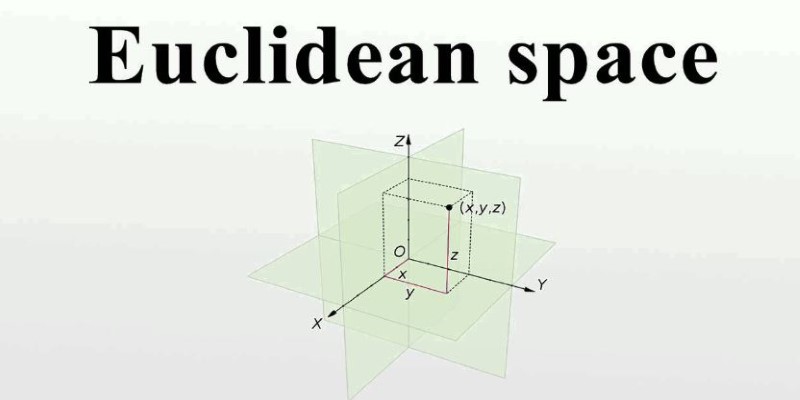
Voronoi cells are always convex in standard Euclidean space, and their edges are straight. This regularity helps with calculations and visual interpretation, which is why they’re often used to analyze spatial data.
Voronoi diagrams show up across disciplines. In geography, they’re used to define zones served by a particular facility. Want to map which homes fall under which fire station? A Voronoi diagram handles that. Each cell shows the area closer to one point than to any other, forming a natural service region.
In telecommunications, they help plan cell towers. Each tower serves the zone closest to it. Diagrams like these reduce coverage gaps and prevent signal overlap. They’re useful for adjusting infrastructure placement and capacity management.
In weather science, radar data is divided into zones based on proximity to radar stations. Rainfall, wind, and temperature patterns can then be assigned spatially using Voronoi cells. This helps refine forecasts and organize meteorological reports.
Computer graphics also benefit. Voronoi patterns are used to simulate textures and generate natural-looking randomness. They help in procedural modeling, terrain design, and even architectural layout. The resulting forms feel organic while being mathematically defined.
In machine learning, classification boundaries often resemble Voronoi diagrams. In k-nearest neighbor models, data points are assigned based on closeness. The model effectively partitions the data space in a manner similar to a Voronoi map. This makes it easier to understand decision boundaries and model behavior.
Biology offers another area where Voronoi diagrams appear. Cell growth in tissues often follows this pattern, especially when individual cells expand until they bump into each other. Plant leaf cells and coral patterns also show similar formations. The diagram reflects how natural forces balance space.
Voronoi diagrams are based on distance, which works well in Euclidean space. However, many real-world problems involve obstacles or rules. For example, road travel involves networks, not straight-line paths. To deal with this, variations like weighted Voronoi diagrams and network-based versions are used.
A weighted Voronoi diagram assigns influence to each site. A hospital might serve a larger area than a clinic, even if slightly farther away. This distorts the cells based on importance rather than strict distance. These versions are especially useful in resource distribution and logistics.
Delaunay triangulation is closely related. It connects sites to form triangles such that no point lies inside any triangle’s circumcircle. The Voronoi diagram and Delaunay triangulation are duals. This relationship is often used in mesh generation, where space must be divided efficiently for computation.
Some applications require dynamic Voronoi diagrams. These change over time as points move—useful in simulations where populations shift, such as in urban planning or animal migration. Although more complex and dynamic versions keep the idea relevant in time-sensitive problems.
Modern computational geometry continues to explore new algorithms for faster and more adaptable Voronoi constructions. These include better support for high-dimensional data, alternative distance models, and interactive environments. Despite their age, the diagrams remain part of ongoing research because they address clear, spatially grounded problems.
Voronoi diagrams are a quiet engine behind many systems we rely on. From how towns plan services to how apps decide which tower to connect to, the principle of closest-point mapping is everywhere. These diagrams don’t just divide space—they reflect the logic of influence and access. What began as a simple geometric idea now reaches into biology, computing, meteorology, and more. Whether used to visualize data or model real-world boundaries, they give structure to problems tied to space. Their clarity and flexibility make them a practical tool for anyone working with location, distance, or spatial relationships.
Advertisement

How Open-source DeepResearch is reshaping the way AI search agents are built and used, giving individuals and communities control over their digital research tools

Explore how π0 and π0-FAST use vision-language-action models to simplify general robot control, making robots more responsive, adaptable, and easier to work with across various tasks and environments

How LLM evaluation is evolving through the 3C3H approach and the AraGen benchmark. Discover why cultural context and deeper reasoning now matter more than ever in assessing AI language models

AI interference lets the machine learning models make conclusions efficiently from the new data they have never seen before

How One Hot Encoding converts text-based categories into numerical data for machine learning. Understand its role, benefits, and how it handles categorical variables
AGI is a hypothetical AI system that can understand complex problems and aims to achieve cognitive abilities like humans

How stochastic in machine learning improves model performance through randomness, optimization, and generalization for real-world applications
Understand how deconvolutional neural networks work, their roles in AI image processing, and why they matter in deep learning

Access to data doesn’t guarantee better decisions—culture does. Here’s why building a strong data culture matters and how organizations can start doing it the right way

Gradio's new data frame brings real-time editing, better data type support, and smoother performance to interactive AI demos. See how this structured data component improves user experience and speeds up prototyping

How Math-Verify is reshaping the evaluation of open LLM leaderboards by focusing on step-by-step reasoning rather than surface-level answers, improving model transparency and accuracy

How to run LLM inference on edge using React Native. This hands-on guide explains how to build mobile apps with on-device language models, all without needing cloud access