Advertisement
Data doesn't always sit still. Social networks shift. Communication bursts come and go. Trade routes adjust. Trying to capture these changes in fixed tables or static graphs can be misleading. That's where temporal graphs prove useful. They track not only connections between entities but also how those connections change over time. This guide explains what temporal graphs are, how they're used in data science, and why they matter. The goal is to keep things clear and simple without skipping the details that make this a practical tool.
A temporal graph is made up of nodes and edges like any other graph, but it includes time. Instead of just saying A is linked to B, a temporal graph says A is connected with B at a specific time and maybe disconnected later. Every node or edge carries either a timestamp or a time range.
There are two ways to model time in these graphs. The first is event-based, logging each action as it happens. The second is interval-based, showing how long something lasted. Both help reveal how a system evolves.
In data science, this matters because behavior isn’t just about structure. It’s about timing. A regular graph tells you who’s involved. A temporal graph shows when things happened. That extra detail is particularly helpful when working with systems where activity isn't steady, such as communication patterns or system logs.
Storing these graphs isn't as simple as adding a time column to a table. Most databases aren't set up to deal with evolving graph states. Two main strategies are used: snapshot and delta models.
Snapshot models save full copies of the graph at specific moments. This makes querying easier but can be storage-heavy. Delta models store only the changes—new links, removed connections, or edits—along with their timestamps. They’re more efficient for change tracking but more complex to rebuild for a specific time.
Many systems use a mix of both. Some graph databases, such as Neo4j or TigerGraph, offer partial support for temporal data. More flexible solutions come from using tools like Apache Flink or Spark GraphX or by designing custom logic in SQL or NoSQL systems.
One key issue when designing a temporal graph is defining what kind of time is being recorded. Is it when the event actually happened (valid time) or when the system recorded it (transaction time)? Confusing these can lead to incorrect results, so the distinction has to be clear in the design.
Temporal graphs have become useful across several fields. In fraud detection, for example, the timing of transactions is critical. A short burst of high-value activity followed by silence can suggest something suspicious. Temporal graphs let analysts detect these patterns in a way that static graphs can't.
In social media, people’s influence shifts. Someone irrelevant today may become central tomorrow. A temporal graph tracks that rise and fall. It helps identify trendsetters, message spreaders, and the moments when groups form or break apart. Static graphs can miss those dynamics.
In transportation or supply chains, routes and relationships don’t stay fixed. Roads close. Shipments reroute. Suppliers change. Temporal graphs help track and adjust to those shifts. They’re used to understand delays, spot weak links, and trace the ripple effects of changes.
Epidemiology is another strong fit. Tracking how a disease spreads means knowing who interacted, when, and for how long. A simple contact list isn’t enough. With temporal graphs, health experts can simulate outbreaks and better understand the timeline of exposure.
Streaming data systems often pair well with temporal graphs. When updates are constant, it's helpful to have models that react in near real-time. Graph processing frameworks can analyze these updates and flag unusual sequences of events right as they happen.
Once stored, these graphs need to be analyzed with time in mind. Questions are no longer simple. Instead of asking, "Are A and B connected?" you ask, "Were A and B connected last month?" or "What changed between time X and Y?"
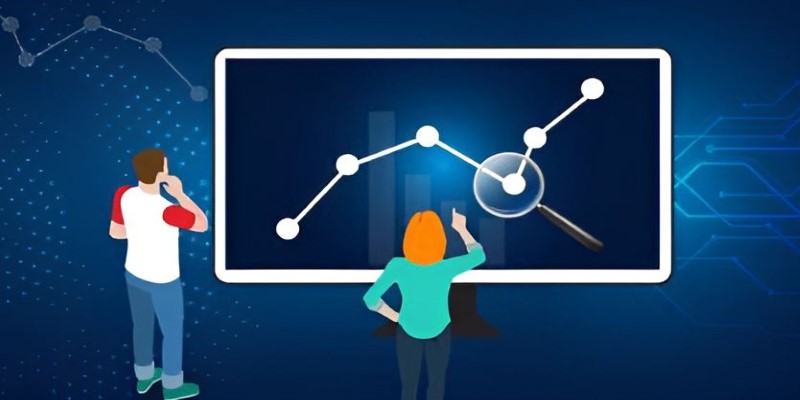
Standard graph algorithms, such as shortest path or centrality, can be adapted. In a temporal setting, the shortest path might not be the fewest links—it might be the fastest one to arrive. Centrality can be tracked over time to see who gained or lost influence.
Temporal pattern mining is another useful technique. You can look for repeating behaviors, sudden shifts, or time-based outliers. These patterns can help in forecasting or triggering alerts. If the same group of nodes frequently interacts at a certain time and then stops, that could indicate fraud or just a shift in interest.
Visualization of these graphs comes with some difficulty. As time adds a new dimension, static displays can become cluttered fast. Interactive visualizations that animate or filter by time are more effective. Tools like Gephi or GraphStream support temporal views with plugins.
On a larger scale, managing temporal graphs requires solid infrastructure. Data arrives out of order. Some timestamps may be missing. Multiple time intervals may overlap. The system must track these issues and provide reliable access to the correct version of the graph when queried.
Temporal graphs help you see systems in motion. They don’t just show who is connected—they show when and how things changed. In data science, this extra context matters deeply. Whether studying social media, finance, health data, or transport, time adds clarity that static snapshots miss. When you model change directly into your graph, new patterns appear consistently. Understanding how to build and work with these models gives analysts a practical and reliable way to handle dynamic, time-sensitive data. With more tools supporting this approach, temporal graphs are becoming a core part of serious data workflows everywhere.
Advertisement
Learn how to bake vertex colors into textures, set up UVs, and export clean 3D models for rendering or game development pipelines
Understand how deconvolutional neural networks work, their roles in AI image processing, and why they matter in deep learning

How to run LLM inference on edge using React Native. This hands-on guide explains how to build mobile apps with on-device language models, all without needing cloud access
AGI is a hypothetical AI system that can understand complex problems and aims to achieve cognitive abilities like humans
Gradio's new data frame brings real-time editing, better data type support, and smoother performance to interactive AI demos. See how this structured data component improves user experience and speeds up prototyping
AI interference lets the machine learning models make conclusions efficiently from the new data they have never seen before
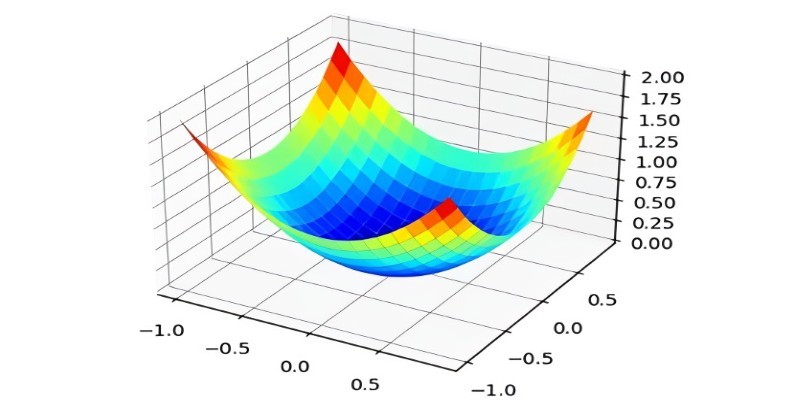
What the Adam optimizer is, how it works, and why it’s the preferred adaptive learning rate optimizer in deep learning. Get a clear breakdown of its mechanics and use cases

Looking to master SQL concepts in 2025? Explore these 10 carefully selected books designed for all levels, with clear guidance and real-world examples to sharpen your SQL skills

Explore the Rabbit R1, a groundbreaking AI device that simplifies daily tasks by acting on your behalf. Learn how this AI assistant device changes how we interact with technology

How Krutrim became India’s first billion dollar AI startup by building AI tools that speak Indian languages. Learn how its large language model is reshaping access and inclusion

Looking for the best podcasts about generative AI? Here are ten shows that explain the tech, explore real-world uses, and keep you informed—whether you're a beginner or deep in the field

How One Hot Encoding converts text-based categories into numerical data for machine learning. Understand its role, benefits, and how it handles categorical variables